Since its introduction in 2008, Google Chrome has grown to become one of the most popular desktop browsers in the world, with some sources placing its market share at around 60%, far outstripping even Internet Explorer. Of course, some of this success can be chalked up to the impressive marketing and promotional power that Google wields, but this can only go so far; the reason it remains popular despite stiff competition is that it offers unique features and integration that other browsers struggle to match.
Nowhere is this more evident than when it comes to the tools available to web developers; Chrome Developer Tools offers a huge range of features to empower your web development process, including analyzing page performance, Javascript debugging and browser-window-based CSS modification. In fact, there’s a whole range of interesting things worth digging up in Chrome, and we’re going to look at a few of them in this article.
Google Chrome Canary
![]()
Alright, so what has a bird got to do with Chrome? Well, as you might have noticed if you’ve used other Google creations, Google have a habit of adopting some rather interesting naming conventions for their releases, like sweets and cakes for Android. However, in this case the naming is a bit more metaphorical; Google Chrome Canary is a special version of the Google Chrome browser which includes all the latest new features that are being tested for full inclusion in a later official release. This is bleeding-edge browser development; Canary is the testing ground for all the latest revisions, and from Canary comes the dev, beta and full releases. In other words, it’s the canary in the mine; it gets to the good stuff first, but there’s an increased danger. Though in the case of Chrome that danger is just an increased risk of bugs or crashes! New versions of Canary are released almost daily, sometimes with minor changes and other times with significant new features, though for the most part you won’t want to be updating daily unless you’re really into browser testing. As you might expect of something so relatively "raw" in terms of development cycle, this version is designed for developers and ‘lovers of novelties’ as the official page states, so it’s really not a good idea to use this as your default browser when you’re working or just wasting time online. However, if you’re the kind of developer that likes to stay on top of what’s coming our way in future versions of Chrome, or if you’re just a regular user who likes tinkering with new features, Canary is a fun and often eye-opening experience. In fact, Canary has recently refreshed the layouts of many of its core elements, including the Developer console, for a more intuitive experience.
Color Eye-Dropper
One of the most helpful features Chrome has to offer is color picker and color management features when debugging CSS styles using the Developer Tools. For those who haven’t used the Developer Tools before, when you open the Developer Tools bar (View → Developer → Developer Tools, or F12 on your keyboard), in the Elements tab you’ll see the source HTML of the site as well as the CSS elements that are being applied to the website, and you can make modifications to the CSS in real-time to see how any changes will be applied. When editing colors of page elements in CSS it’s just a case of modifying the hexadecimal value of the color attribute in the CSS, which Chrome makes much easier by including a color picker tool; simply click on an element in the HTML which contains some color CSS properties like color, background or border you can get access to the color picker tool and other details by clicking on the color preview box.
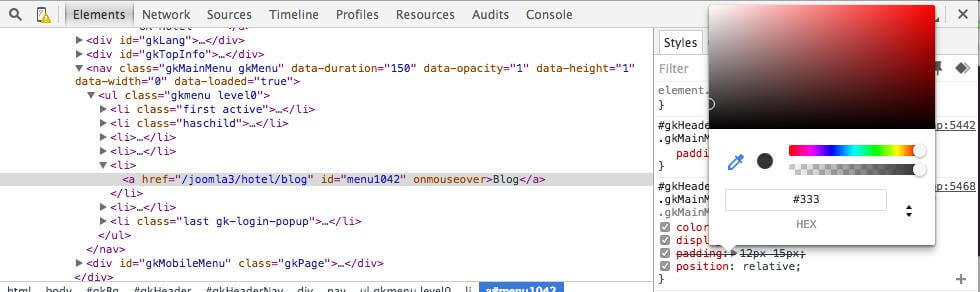
You may find that the screenshot above doesn’t look much like the color picker you see when modifying colors in Chrome; that’s because this screenshot is taken from Canary; remember I mentioned that Canary recently implemented a UI refresh? Well, now you can see one of the changes it included, since it now boasts a much clearer, intuitive layout. That’s not the only change though; they’ve added an icon for another cool feature Chrome offers that makes matching colors a breeze. Now, when I say "Added an icon" that’s exactly what I mean; the feature already exists in the current version of Chrome, but for some reason no icon or button was added to the UI to let you know the feature was there! On the left of the color picker block is an eye-dropper icon that, when clicked, will let you measure the color of any element in the browser window and immediately use it to set the color of another element in loaded CSS to preview changes. Seen a nice color on a site you’ve visited? Use the eye-dropper tool and you can get the color value not only in HEX but in RGBA or HSLA format by clicking on top/bottom arrows near color value input, ready for you to apply on your own site.
What about using this feature in the standard Chrome release? Quite simply, actually. When checking a color element in the developer console, click on the little color block next to the color’s hex value to bring up the color picker, then just move your cursor back into the browser’s viewport; you’ll see the zoom circle that lets you pick a particular pixel of an image to get the exact color you want to copy.
Debugging minified CSS or JavaScript
Running a CSS and JavaScript minification process is a standard today if you want to provide the best site performance possible (short of making a site that looks like it’s from 1995). During the development process most developers use ‘raw’ code rather than obfuscated or minified code so it’s easier (relatively-speaking) to debug the code, but sometimes something goes wrong after page roll-out and we need to quickly check which line is throwing up errors. With a minified source it’ll be hard since all the code’s on one line (to save a few bytes from new line characters) so in most cases you’ll get the rather unhelpful prompt that the error is in line number…1. Don’t worry though, you don’t need to load the original uncompressed code to figure this out – Developer Tools can do it for you. When you open the file that you want to check in the console (for example in the screenshot here I’m using the main CSS file from our latest Villa Belucci template) you can click on the small button that displays the brace {} characters and beautify the code.
DevTools Console syntax highlighting
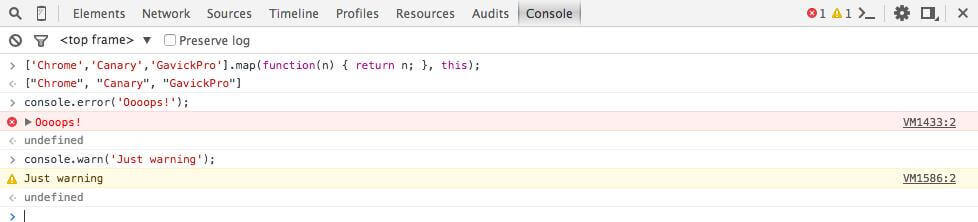
Pretty much everyone who’s ever created some JavaScript code has at least once used the console.log statement to output some variables to the console so they can check what may be wrong with the code. The DevTools console is also very useful when you want to check code before adding it to a page’s JS files; just add the code into the console and click ENTER to run the code in your browser. If you haven’t used this feature much in the past you may not notice right away that this this console element supports syntax highlighting. Apart from this, you can also extend the well-known console.log command with console.error and console.warn, which will output messages on a red or yellow background. It is really useful when you’re debugging some border cases or your code is full of console.log() statements!
Preview mobile layouts with navigation or on-screen keyboard enabled
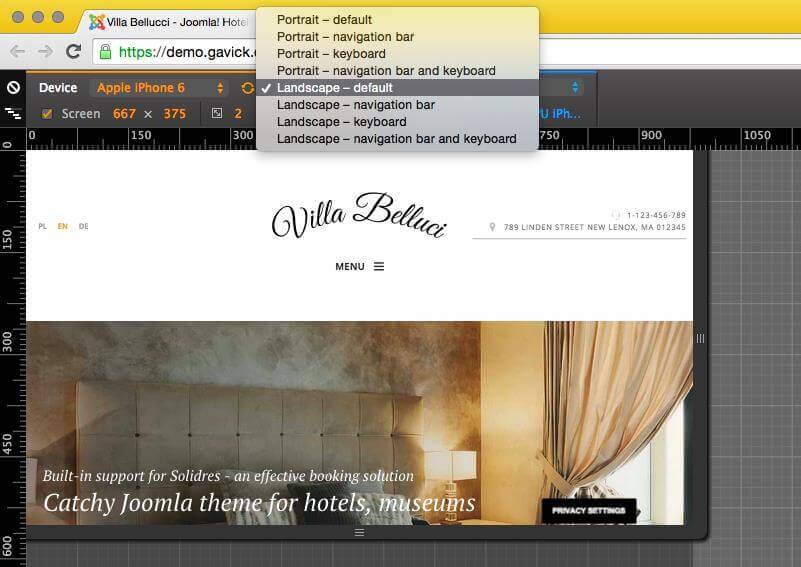
Most developers, but not too many standard users, are aware that DevTools provides us with a great emulator for previewing your website on many different types of devices. With it, we can choose the device, screen size and the orientation of the screen within the emulator, but if you’re running Canary then you can also preview the page result with a device’s native keyboard or navigation bar area enabled too. Of course we won’t actually see a perfectly-emulated keyboard with all the bells and whistles; the browser will just show a grey rectangles on the places when keyboard or navigation bar will appear so you may check whether you website has something more than a logo visible with an open keyboard, which is not as rare an issue as you may think!
Easily find a CSS element on a website
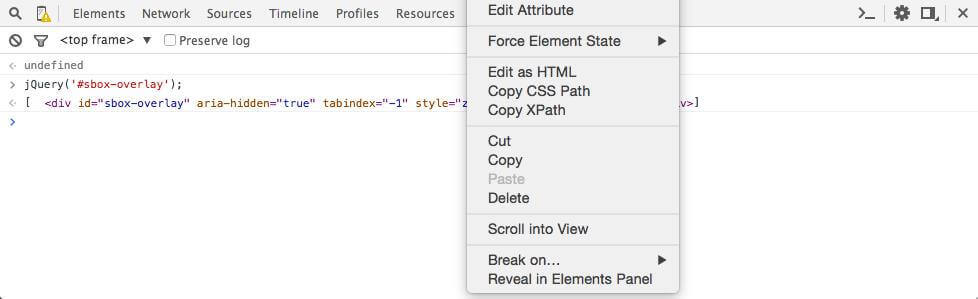
This is my favourite tip of the lot, so I’ve saved it till last! Sometimes you’ll need to figure out the ID or class of a particular CSS container in the page source. Of course you can search and then use the highlight elements feature, but if we’re going to be doing this a lot then we’ll want to use the fastest method possible. As you remember we’ve got a console available where we can insert and execute JavaScript code, so we can use this to our advantage. As an example, let’s say I need to find a <div> with the id: sbox-overlay. This element isn’t visible on the website so I can’t just select the element using the magnifying glass icon and preview the styles to find the class. An alternative here would be to search until you eliminate multiple elements and can narrow the search down to what you’re looking for. But for me, the fastest method is to take advantage of the console. In our templates we use the jQuery library, so we can just type the following command into the console command line:
jQuery('#sbox-overlay');
and click enter to see the results. When you right-click on the result item and in the choose the Reveal in elements panel option in the context menu you will be immediately redirected to the Elements tab, and the selected element.
Last but not least – If you’re doing a lot of debugging and the console is full of output you can always use clean(); command to remove all the content and start again with fresh and clean output area.
We hope that this article’s tips help you speed up your development process and save you a ton of frustration! If you’ve got a little trick or two that you’d like to share, why not pop it in the comments below; we’re always interested in hearing new ways of getting things done that little bit faster or smoother.